


Mid-Year 2025 Global Economic Outlook: Economic Shifts in a Post Tariff World


Vice President, Economist
- After a slow but steady first half of the year, global GDP growth is expected to decelerate in the second half of 2025. Sentiment has recovered from the tariff shock in April, but lingering trade and geopolitical uncertainties will continue to weigh on global growth.
- The near-term inflation outlook is complicated by recently implemented and planned US tariffs and sharp foreign exchange fluctuations. We expect inflation to pick up in the US while decelerating in the EU and East Asia.
- Rising fiscal imbalances are a concern as governments increase spending to support domestic economies amid heightened global policy uncertainties and geopolitical tensions, which bear important consequences for debt servicing costs.
- Emerging Asia is trying to counter the global headwind with progressive policies. China is introducing more policy support for consumption and “new economy” sectors, while India is focusing on domestic consumption, infrastructure, green energy and digitisation. Among the ASEAN markets, the key policy imperative is to deepen regional economic integration.
The global economic outlook for the second half of 2025 is clouded by policy uncertainty, geopolitical risks and concerns around rising fiscal imbalances. In the first half, front-loading of trade likely helped keep global growth steady, with potential contraction in US real GDP offset by a boost to the export-oriented economies. Global GDP growth is expected to weaken to between 2.3% and 2.9% in 2025 (down from 3.3% in 2024), according to estimates from the World Bank[1], OECD[2] and the IMF.[3] These various projections assume heightened trade barriers would remain in place, thus denting global demand. Despite these challenges, emerging markets, particularly in Asia, are expected to grow at a relatively steady pace of 4.5% in 2025, albeit slightly moderated from 5.3% in 2024, according to the IMF.
Business and consumer sentiments were shocked by the “Liberation Day” tariff announcements in April; however, they have since recovered. June’s flash Purchasing Managers’ Indexes (PMIs) for the G4 economies and consumer confidence indicators have both stabilised during the ongoing 90-day pause (until 9 July, which has been extended to 1 August) on US tariffs. The relief in sentiment is also reflected in easing financial market conditions.
Figure 1: Consumer confidence across major economies has recovered from April 2025
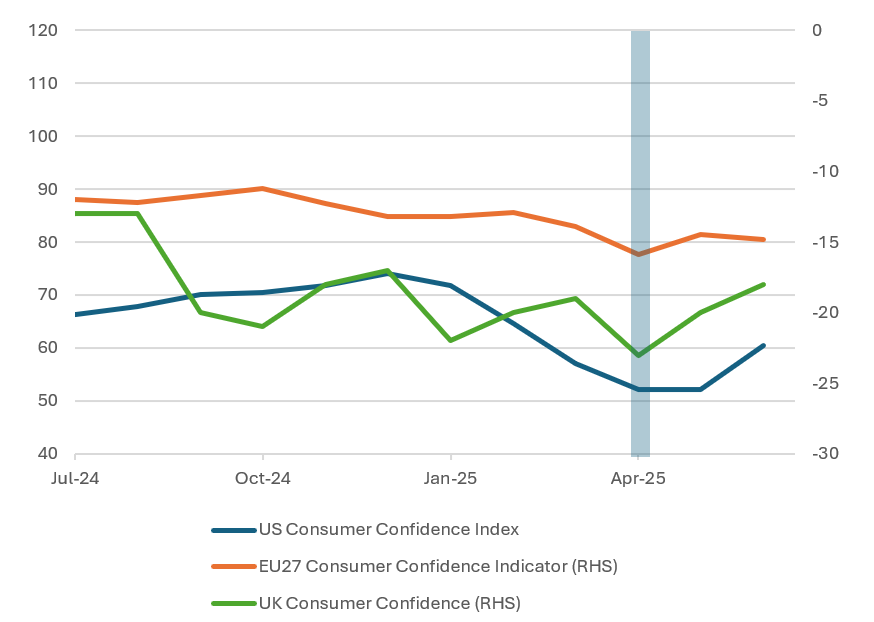
Source: CEIC
Inflation in major economies is broadly trending lower. In the US, the impact of higher tariffs and a weaker dollar is expected to feed through to higher input costs and consumer prices. So far, the impact on US inflation has been muted – core PCE index, the Fed’s preferred measure, rose only slightly to 2.7% year-on-year in May. Nonetheless, indications from the ISM PMI (Institute of Supply Management Purchasing Managers’ Index) show that underlying price pressures have gained upward momentum (Figure 2).
On the other hand, export-oriented economies in Europe and Asia may face increasing disinflationary pressures from slowing global demand, as well as recent appreciation of their currencies against the US dollar.
Figure 2: US Manufacturing and Services PMI price index points to rising underlying inflation in the US
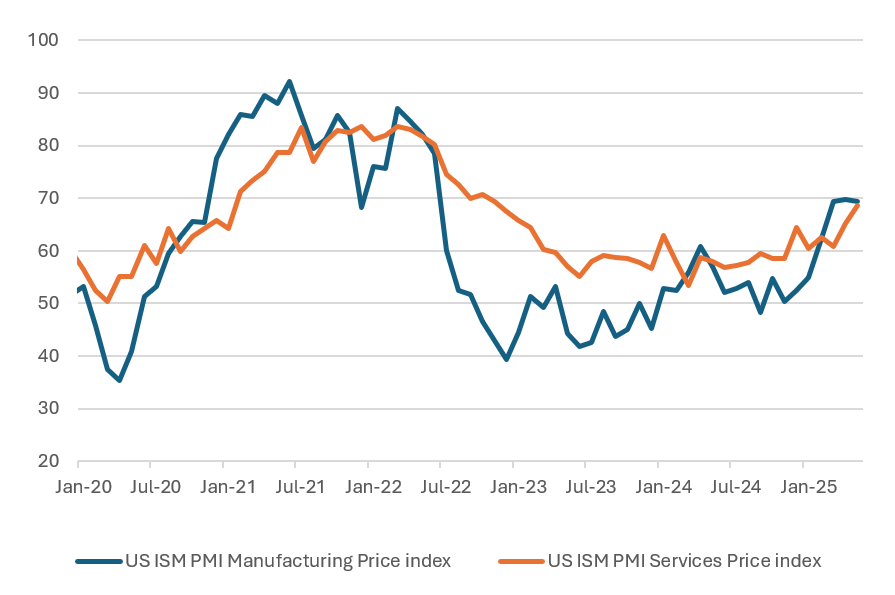
Source: CEIC, ISM
Monetary policy is cautiously dovish across the globe, with central banks reducing interest rates at varying speeds. Europe, China and East Asia are likely to see a faster pace of rate reduction, while the US Federal Reserve is likely to await further data on the impact of tariffs and inflation expectations before considering a cut to the federal funds rate.
As economies seek to stimulate growth, fiscal spending is expected to increase globally. Slowing growth and geopolitical fragmentation are cementing the case for fiscal spending, as evidenced by the shift away from fiscal conservatism in Germany and the Chinese government’s increased fiscal stimulus over the past year. Global public debt-to-GDP ratio is estimated at 90% in 2025 and exceeds 100% for several advanced economies (including the US, Japan, Italy, France, Spain, Canada and the UK), with debt rising faster than revenues and GDP for many emerging market economies as well.[4]
The US’s Big Beautiful Bill (BBB) is expected to further increase the US fiscal deficit to 122-129% of GDP by 2034, compared to a baseline projection of 117%[5]. At the same time, Japan is planning a continued increase in defence and social security spending in 2025[6]. Defence budgets are rising elsewhere as well - the EU plans to invest up to EUR 800 billion in defence capabilities by 2030[7].
Excessive fiscal imbalances have long-term consequences for growth, including higher borrowing costs, crowding out of the private sector, and increased vulnerability to economic shocks. Yields on long-dated US and Japanese government bonds have moved higher, in part due to fiscal concerns (in addition to inflation concerns and reduced central bank purchases), which in turn raises long-term debt servicing costs in these economies.
Figure 3: Global public debt-to-GDP ratios are projected to rise
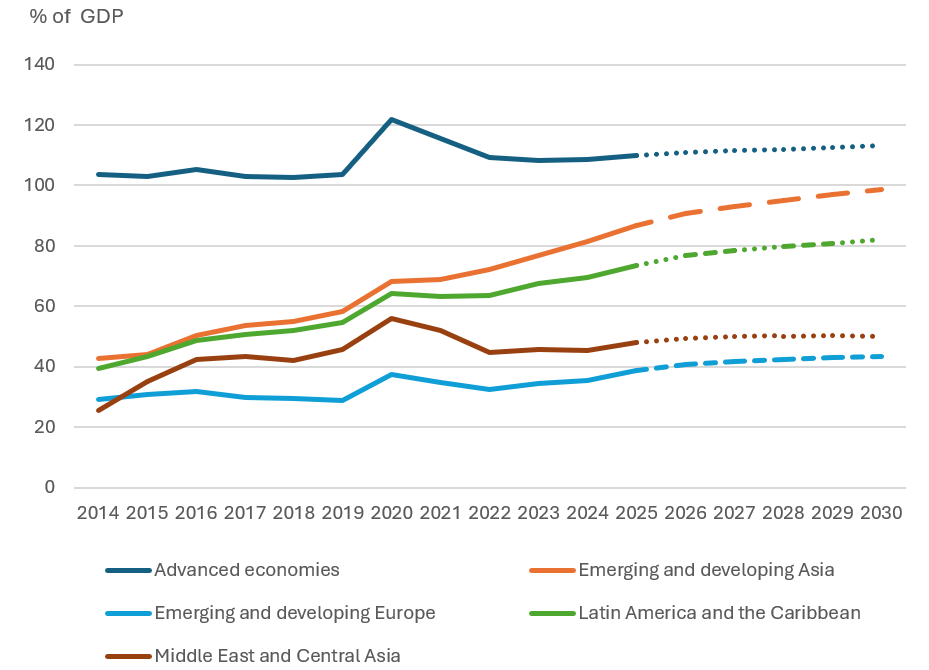
Source: IMF WEO database April 2025
China: Policy support for consumption and the “new economy” gathers pace, countering external headwinds
In China, the second half of the year will be a balancing act between government stimulus-driven stabilisation and external headwinds, against a backdrop of structural drags from the property sector and deflation. China’s 2025 GDP growth target is ambitiously set at “around 5%”[8] despite a challenging external environment, indicating strong policy support for the domestic economy.
China’s fiscal deficit target for 2025 was raised significantly to 4% of GDP from 3%[8] – a move unseen in the last decade. Targets for special local government bond issuance and ultra-long-term bond issuance have been increased and monetary policy direction has shifted to “moderately loose” from “prudent” after 14 years. Increases in government spending – particularly on social policies, transfers and health services, as well as incentives for trade-in programs and adjustments to minimum wage mechanisms, are expected to support consumption demand.[9]
The effects of these policies were reflected in an uptick in retail sales for May and in the resilience of the services sector. Consumer confidence has stabilised, and willingness to spend is creeping up, especially among rural consumers. However, the still downbeat property sector continues to weigh on urban consumer sentiment. While the drag on GDP growth from this sector is being reduced thanks to government stabilisation measures, home prices are still in decline, and real estate investment remains lacklustre.
On the external front, a potential US-China tariff deal could provide temporary relief. However, US tariffs on Chinese imports are expected to remain high, at 55%[10], in addition to industry-specific tariffs (for example, on steel and EVs), which are sufficient to slow bilateral trade. An unwinding of export front-loading is expected to weigh on activity in the second half of the year, with the manufacturing PMI for June already foreshadowing a contraction. The fundamental undercurrents of economic fragmentation and competition mean that trade drag is likely to persist, and exporters would continue to diversify into other fast-growing markets to offset declining shipments to the US.
Another strategic focus – the “New Economy”, namely clean technology, digital economy and high-tech manufacturing – is gaining momentum. Clean technology (including new energy vehicles (NEVs), batteries and solar power) contributed 10% to China’s GDP in 2024[11] (Figure 4), while the digital economy (including AI, fintech) contributed a similar 10%[12], showing that these sectors could become viable engines of future growth. The largest share of these comes from NEVs. In 2024, China produced 13 million NEVs, a 34% increase, of which 22% were exported. Domestically, market acceptance has expanded, supported by government subsidies. An estimated 43% of all Chinese clean-tech exports (including renewable technologies) in 2024 went to overseas emerging markets, up from 24% in 2022[13], showing that the pivot to the Global South could deepen amid trade barriers elsewhere.
Figure 4: Contribution of clean-energy sectors to China’s GDP
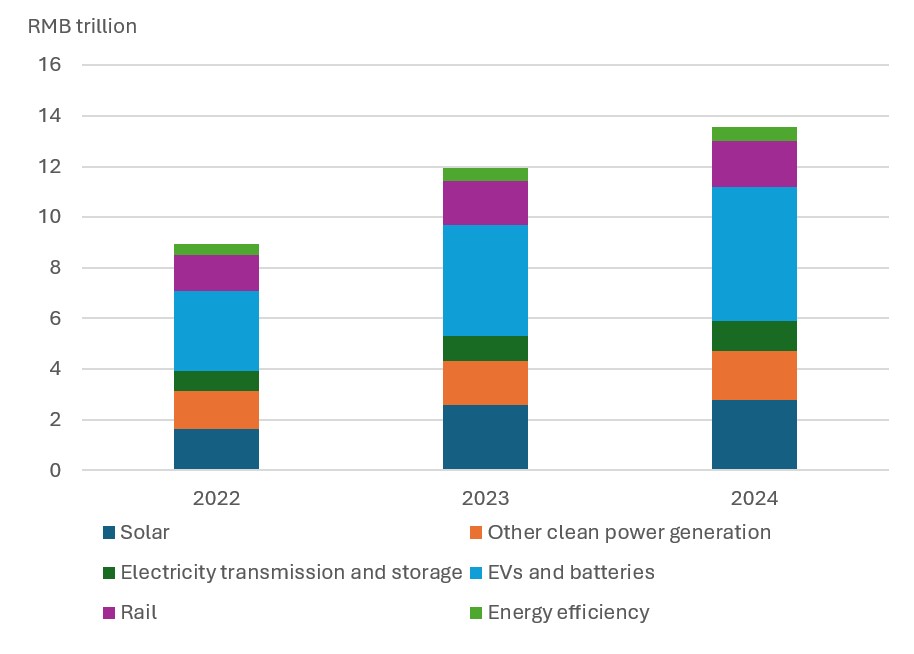
Source: Centre for Research on Energy and Clean Air
India: Multi-dimensional growth based in strong consumption demand, infrastructure investment, and new sustainable growth drivers
India continues to be an upbeat story in a world where geopolitics and technological competition are reshaping economies. The IMF projects India’s real GDP growth at 6.2% for 2025 and 6.3% for 2026, on strong domestic consumption demand and investment. Low dependence on the external economy means that the economy is relatively well-shielded from US tariff uncertainties and potentially stands to benefit from the restructuring of the global supply chain.
The decline in inflation (May CPI inflation at 2.8%) and monetary easing in June add to the tailwinds for private sector consumption and investment (Figure 5). The FY2025-26 budget announced income tax cuts for the middle-class[15], potentially adding further momentum to consumption. Moreover, government capital expenditure continues to grow, with investments in infrastructure, logistics and green energy providing multiplier effects across the economy.
Figure 5: India: declining inflation and interest rates provide a tailwind for private investment and growth
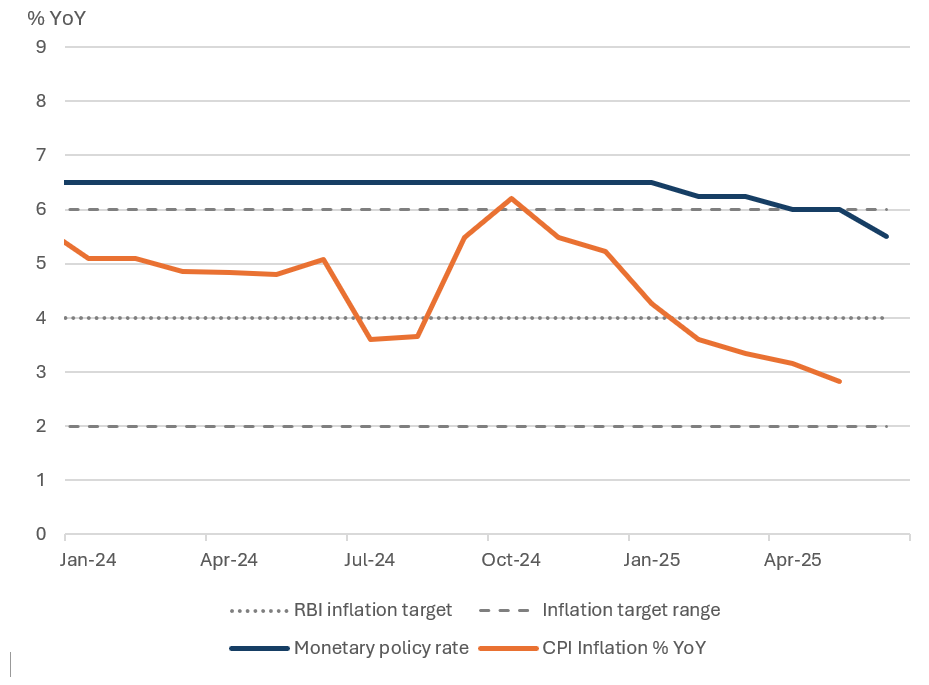
Source: CEIC, RBI
Green energy and financial inclusion are gaining traction from both the public and private sectors. In 2024, India added 14% to its new renewable capacity, with several mega green energy projects in the pipeline[16]. Digital payments continue to see robust growth, with transactions increasing 35% in volume in FY2024-25 from a year ago[17]. A high digital adoption rate of 87% has opened up significant opportunities for fintech growth.
Overall, robust consumption, government infrastructure expenditure, tailwinds from low inflation and interest rates and impetus for digital and renewable energy are solid pillars of India’s multi-dimensional growth amid benign external risks.
ASEAN: External headwinds present a strategic opportunity for regional integration
The ASEAN economies are underpinned by a diverse mix of growth drivers. GDP growth for Southeast Asian economies is projected at 4.7% for 2025.[18] However, the overall numbers mask a more complex outlook. The region benefits from supply chain diversification and the “China+1” strategy; however, rising trade headwinds mean that external growth and investment will still likely slow in the near term. The export-reliant economies – Vietnam, Singapore, Thailand and Malaysia – are vulnerable, with Vietnam particularly exposed to US tariffs[19] given its significant proportion of exports to the US. Foreign direct investment (FDI) to the region is also expected to slow amid high business uncertainty.
Indonesia and the Philippines, with their stronger domestic demand, infrastructure spending, and a resilient services sector, are likely to lead regional growth. Another major regional support comes from tourism, which has rebounded to pre-Covid-19 levels across Indonesia, Thailand, the Philippines and Vietnam. Furthermore, benign inflation and fiscal conservatism provide space for monetary and fiscal levers to support growth.
Amid rising external challenges, regional integration is expected to gain more traction as a strategic hedge. The region’s young and growing demographic, along with its existing supply chain advantage, presents opportunities to benefit from deeper regional cooperation. Intra-ASEAN trade accounts for about 22% of ASEAN’s total trade, far below the EU’s 60%[20], implying ample potential to unlock new trade flows.
The ASEAN 2045[21] vision framework, released in May 2025, aims to achieve a seamless regional market, co-create supply chains, enhance trade routes and logistics cooperation, and develop shared digital infrastructure as its cornerstones. Work is underway on labour mobility, power grid linkage and connecting real-time payments systems. It is estimated that implementing the ASEAN economic community could boost the region’s GDP by 5% by 2030.
Summary
The global economic outlook for H2 2025 reflects a world in the midst of strategic transition. As economies react to US tariffs and a more fragmented world order, Asia is responding in diverse ways.
China is leaning on fiscal support to boost consumption and pivot towards the “new economy” sectors. India continues to demonstrate resilience, underpinned by strong domestic consumption, government capital spending, green investment and fintech momentum. ASEAN economies have diverse growth drivers, and are responding to external vulnerability by increasing economic integration as a strategic hedge.
Together, these shifts underscore a rebalancing in global growth, where policy coordination, domestic market development, and adaptation to a changing world order become defining themes in the new era.
[1] Global Economic Prospects: Global Economy Faces Trade-Related Headwinds, June 2025
[2] OECD: Global economic outlook shifts as trade policy uncertainty weakens growth, 3 June, 2025
[3] IMF World Economic Outlook Growth Projections, April 2025
[4] UNCTAD: A world of debt, Report 2025. It is time for reform, April 2025
[5] CONGRESSIONAL BUDGET OFFICE: Effects on Deficits and the Debt of Enacting H.R. 1 and of Making Certain Tax Policies in H.R. 1 Permanent, 12 June, 2025
[6] NikkeiAsia: Japan's defense budget nears 2% of GDP as Trump pressure looms, 16 April, 2025
[7] European Commission: Acting on defence to protect Europeans, 28 March, 2025
[8] People’s Daily: 2025 National Two Sessions: China Government Work Report, 6 March 2025
[9] People’s Daily: 2025 National Two Sessions: China Government Work Report, 6 March 2025
[10] The State Council PRC: China unveils plan on special initiatives to boost consumption, 16 March 2025
[11] World Economic Forum: US-China trade framework agreed and other international trade stories to know this month, 17 June, 2025
[12] Carbon Brief: Analysis: Clean Energy contributed a record 10% of China’s GDP in 2024, 19 February 2025
[13] China Daily: China's digital economy to exceed 10% of GDP by year-end, 19 May, 2025
[14] Financial Times: China’s clean tech exports to emerging markets surged in 2024, data shows, 28 April 2025
[15] India Ministry of Finance: SUMMARY OF UNION BUDGET 2025-26, 1 February 2025
[16] India: Year End Review 2024 of Ministry of New & Renewable Energy, 31 December, 2024
[17] Reserve Bank of India: Annual Report, 29 May, 2025
[18] ASIAN DEVELOPMENT OUTLOOK: TRADE UNCERTAINTY CHALLENGES RESILIENCE IN ASIA AND THE PACIFIC, APRIL 2025
[19] Following the Vietnam-US trade deal, new tariffs of 20% have been imposed on Vietnam’s exports to the US, with a 40% levy for trans-shipments. Vietnam Briefing: US Tariffs on Vietnamese Exports: Analyzing the New Framework, 3 July, 2025
[20] ASEAN Statistical Brief, EXPLORING INTRA-ASEAN MERCHANDISE TRADE DYNAMICS, May 2024
Disclaimer
Peak Re provides the information contained in this document for general information purposes only. No representation or guarantee is made as to the accuracy, completeness, reasonableness or suitability of this information or any other linked information presented, referenced or implied. All critical information should be independently verified and Peak Re accepts no responsibility or liability for any loss arising or which may arise from reliance on the information provided. All information and/or data contained in this document is provided as of the date of this document and is subject to change without notice. Neither Peak Re nor any of its affiliates accepts any responsibility or liability for any loss caused or occasioned to any person acting or refraining from acting on the basis of any statement, fact, text, graphic, figure or expression of belief contained in this document or communication.
All rights reserved. The information contained in this document is for your information only and no part of this document may be reproduced, stored or transmitted in any form or by any means, electronic, mechanical, photocopying, recording or otherwise, without the prior written permission of Peak Re. Any other information relating to this document, whether verbal, written or in any other form, given by Peak Re either before or after your receipt of this document shall be provided on the same basis as set out in this disclaimer. This document is not intended to constitute advice or recommendation, and should not be relied upon or treated as a substitute for advice or recommendation appropriate to any particular circumstances.
© 2025 Peak Reinsurance Company Limited.
Other Insights

Wed, 21 May 2025
| 19 mins
|
Kritika Kashyap
Fri, 25 Apr 2025
| 19 mins
|
Clarence Wong

Wed, 16 Apr 2025
| 14 mins
|
Kritika Kashyap

Fri, 21 Mar 2025
| 8 mins
|
Limin Chen

Wed, 22 Jan 2025
| 13 mins
|
Clarence Wong

Elevate Your Business
with Peak Re
with Peak Re